interactive network traffic analysis
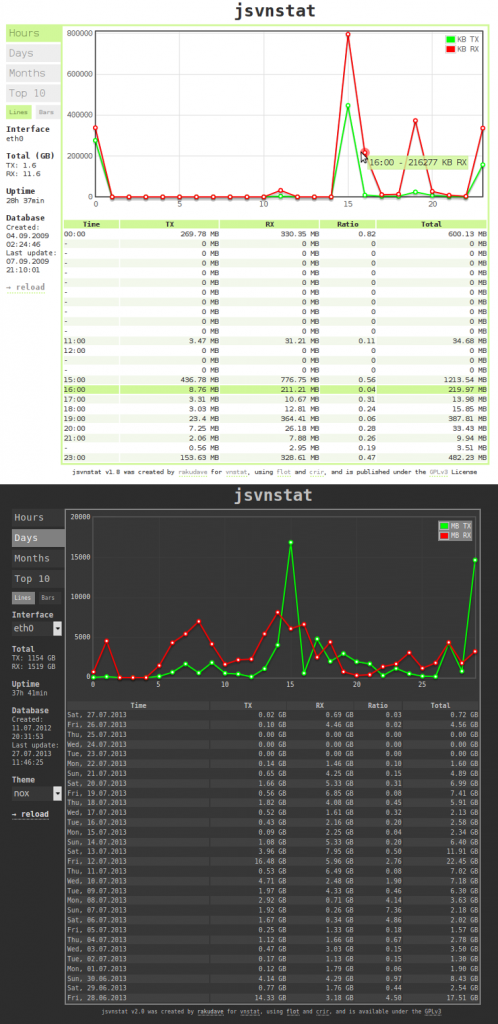
 jsvnstat is a web frontend for vnstat. It is largely based on javascript, so you can easily switch views without reloading the entire page. The graph is interactive, just hover over a datapoint to see what I’m talking about. You can switch between line- and bar-graphs. You can also change settings such as decimal numbers in the settings.php file.
Requirements
– vnstat installed and working
– vnstat database created (vnstat -u -i eth0)
– running webserver with PHP support
– vnstat executable from the web, popen enabled (check PHP security settings)
Installation
– Copy all provided files to your webserver
– Apply appropriate permissions (chown -R www-data some/where/jsvnstat)
– Adjust settings.php if necessary
License
jsvnstat is published under the GPLv3, libraries under their respective licenses.
Changes
2.0
+ interface detection and interface selector. Idea: Vitali, mike2nl
+ nox theme and theme selector
+ more settings (date format, dropdowns, theme)
* refactoring (better separation, vnstat info by-name). Idea: Teemu Toivola, Ian Kumlien
* improved number display in table
* made hour table behave more like the others (current hour first). Idea: Ian Kumlien
* updated flot and jQuery libs
Hi,
Wanted to isntall jsvnstat on Ubuntu 16.04.
Unfortunately I wasn’t able to set it up.
Any general experience, if it works on ubuntu 16.04?
Error message: Failed to retrieve data from vnstat!
vnstat is installed and works properly.
How to feed the front-end with data?
I suspect that vnstat is not available to PHP because “popen” is not allowed – check the apache log file (usually at /var/log/apache2/error.log)